
Why consider preferred shares?
Preferred shares offer the Canadian investor steady income in the form of tax-advantaged (when held within a taxable non-registered account) eligible dividends. The dividends are usually greater than interest income even before taxes for debt of comparable credit rating and term. With interest rates being so chronically low these days, that can be appealing.Preferred dividends have claim to company profits after bonds, so there is extra credit risk. On the other hand, compared to common share dividends, preferred dividends have prior claim, though the offsetting downside is that preferred shares do not have the opportunity for capital growth like common shares. Preferred shares stand in the middle between common shares and debt and are generally considered an income investment (see Blackmont Capital's primer on preferred shares, linked to by RetailInvestor.org's preferred share page, which delves into some of the pros and cons in more detail).
Why an ETF?
ETFs devoted to preferred shares offer a convenient way to invest. One purchase can create a permanent low maintenance holding that contains a widely diversified assortment of individual securities, lowering risk of exposure to individual companies. There's no need to rebalance or reinvest when securities are called, no need to figure out which individual securities to buy or sell, it is all done within the ETF by the managers.
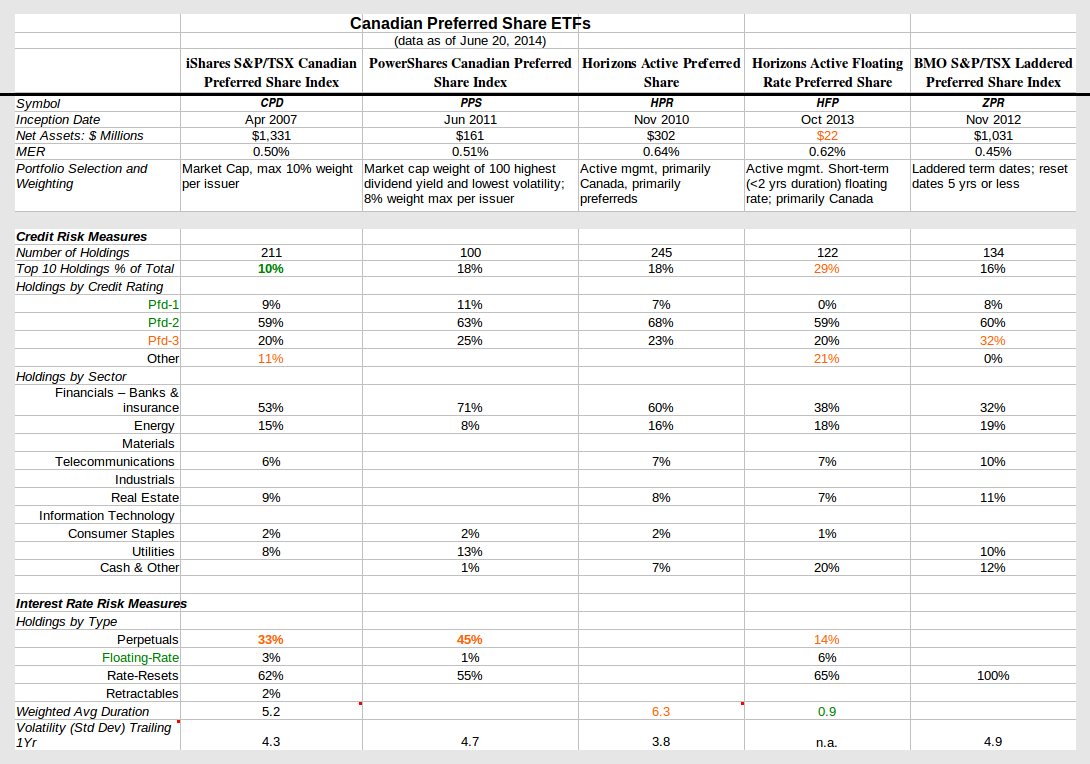
There are currently five ETFs focused on Canadian preferreds. We leave aside US-based offerings since foreign preferred dividends are treated as ordinary income on Canadian taxes and lose their tax advantage. All offer fairly similar expense ratios around 0.5% per year. There are however some fairly marked differences between the funds in their mix of types of preferred share holdings and consequently sensitivity to interest rate changes.
There are currently five ETFs focused on Canadian preferreds. We leave aside US-based offerings since foreign preferred dividends are treated as ordinary income on Canadian taxes and lose their tax advantage. All offer fairly similar expense ratios around 0.5% per year. There are however some fairly marked differences between the funds in their mix of types of preferred share holdings and consequently sensitivity to interest rate changes.
The ETFs
- Horizons Active Floating Rate Preferred Share ETF (TSX: HFP) - an actively managed ETF where managers apply their judgement, targeting short-term income while keeping value stable despite interest rate change effects; still tiny at $22 million in assets since October 2013 start-up; MER 0.62%
- iShares S&P/TSX Canadian Preferred Share Index ETF (TSX symbol: CPD) - oldest (2007 inception) and largest in assets at $1.3 billion; strategy is to passively track the overall preferred share market; MER 0.50%
- BMO S&P/TSX Laddered Preferred Share Index ETF (TSX: ZPR) - second largest fund at $1.0 billion assets, has been catching up quickly to CPD since 2012 inception; invests in a 5-year ladder of preferreds that reset rates. Lowest MER at 0.45%
- Horizons Active Preferred Share ETF (TSX: HPR) - another actively managed fund "to provide dividend income while preserving capital"; highest MER at 0.64%
- PowerShares Canadian Preferred Share Index (TSX: PPS) - founded in 2011 but changed its index in May this year to target lower recent volatility and higher dividends whereas before it screened only on liquidity, resulting in a huge shift to a heavy weight in fixed rate perpetual preferreds; MER 0.51%
Diversification and credit risk - trading off sector concentration vs credit rating
As our comparison table above shows, all funds have a substantial chunk (20% or more) of holdings in in credit rating Pfd-3, which is below investment grade of Pfd-1 or Pfd-2. The fund with the most holdings below investment grade - ZPR at 32% - makes up for it by having a more even spread across sectors and a low concentration in the top 10. Another fund that is highly concentrated in banks and insurance companies - PPS, at 71% - makes up for that by the highest proportion of holdings in the top Pfd-1 credit rating at 11%. HFP has the most concentrated top 10 at 29% but a wide sector spread. There doesn't seem to be any ETF that is clearly superior to the others.
We note also that there has been a significant decline in the overall credit quality of CPD over the last six years as the comparison with statistics by James Hymas in a 2008 Canadian MoneySaver article shows. The proportion of the highest rated Pfd-1 holdings was 65% in October 2008 vs only 9% today. Many major bank issues got cut from Pfd-1 to Pfd-2. Pfd-3 holdings have also risen substantially. Many new issuers offering preferred shares, such as industrial companies, are below investment grade. Lower credit quality raises credit / default risk.
We note also that there has been a significant decline in the overall credit quality of CPD over the last six years as the comparison with statistics by James Hymas in a 2008 Canadian MoneySaver article shows. The proportion of the highest rated Pfd-1 holdings was 65% in October 2008 vs only 9% today. Many major bank issues got cut from Pfd-1 to Pfd-2. Pfd-3 holdings have also risen substantially. Many new issuers offering preferred shares, such as industrial companies, are below investment grade. Lower credit quality raises credit / default risk.
Interest rate risk exposure - the biggest differentiator
Four funds appear to be most exposed to changes in interest rates - CPD, PPS, ZPR and HPR - though it is hard to tell which is most exposed. The weighted average duration (which is a measure of sensitivity to interest rate change, the higher the number the greater the sensitivity) of their holdings at 5.2 for CPD and 6.3 for HPR are one indication. In comparison, the broad benchmark bond ETF from iShares (TSX:XBB) has a duration of 7.09 while a short-term bond fund - iShares' XSB - has a duration of 2.87. Though Invesco does not provide a duration figure for PPS, we estimate that it will have a similar interest sensitivity by virtue of its large 45% component in perpetuals, which are by far the most sensitive type, as seen in the following chart from Scotia McLeod's Guide to Preferred Shares.

Horizons' HFP is the least sensitive to interest rates, with a duration of only 0.9, a reflection its policy to keep holdings in short-term resets and floating rate preferreds. BMO's ZPR theoretically should fit in between HFP and the others, with its strategy of holding preferreds that will reset rates in five or less years. But the price action of the various ETFs seen in the chart below contrasting ZLB vs the other preferred ETFs and XBB suggests that it behaves much like CPD. And HPR has been less volatile than CPD and ZPR - it looks as though the active management strategy of HPR "to preserve capital" has been effective.

Despite the higher duration of XBB, CPD and ZPR dropped more in 2013 when interest rates took their upward spike.
Attractive payouts and reasonable but volatile returns
An important lesson for investors is that preferred share ETFs can be quite volatile compared to bonds. In 2008-2009 during the credit crisis and the recovery, CPD took a big drop in 2008 with a 17.2% negative return and in 2009 with a 26.2% positive return while XBB toddled along smoothly at +6.1% and +5.0% respectively.
Our second comparison table below shows recent cash payout rates. Four of the ETFs are paying out 4.1 to 4.9% depending on which payout measure is used, while HFP is paying 2.1 (trailing 12 months) or 3.4% (current yield). That's attractive income compared to XBB's 3.2% distribution yield and 2.4% yield to maturity, especially when tax rates are taken into account (it can take $1.30 of pre-tax interest to equal the net after-tax of $1 of dividends in a taxable account, though this varies depending on the investor's tax bracket and province) and the fact that a good chunk of the preferred ETF payouts has been non-taxed Return of Capital.

However, not all is sweetness and light. Returns - which includes both dividends and capital gains/losses - have not been nearly so attractive in the short term. Three of the four (CPD, ZPR and PPS) that have been around long enough (at least a full year) to officially report returns show negative 1-year returns. The 2013 interest rate rise hurt capital values. In addition, the capital losses seen in the above price chart have caused the ETFs to have bad Return of Capital, merely giving investors their own money back. As a recent Raymond James Canadian Preferred Shares Report points out (see pages 2-3) many of the Reset preferreds are being and will be called in 2014 by the issuers and new issues will have lower dividend rates. The reality of the low interest rate environment is being absorbed and cash payouts have been falling.
It is very hard to predict exactly how an investment in these preferred ETFs will fare. There is such a mix of inter-acting factors that can affect eventual returns and future income / cash payouts - interest rates, most obviously, but also credit risk, call risk (likelihood of issues being redeemed prematurely, when it advantages the issuing company and not the investor), the required return differential between government debt and corporate preferreds, the variable mix of types of holdings within each ETF and the wide variety of special redemption or retraction features attached to the types of preferred shares. Finally, and ironically, to some extent the tail is wagging the dog - flows into or out of the ETFs themselves are so large that they affect the market for underlying preferred shares according to Scotia McLeod's annual Guide to Preferred Shares 2014 edition. Unlike bond index funds whose future possibilities under rising interest rates we examined last year, we would hesitate to forecast the probable evolution of any of these ETFs in detail. Certainly, if interest rates rise, the capital value / market price of the ETFs will fall in response, but by how much and for how long is too hard to tell.
Bottom line - Though it is not possible to predict exactly what will happen, the ETFs would slot into a fixed income portion of a portfolio as follows:
Disclaimer: This post is my opinion only and should not be construed as investment advice. Readers should be aware that the above comparisons are not an investment recommendation. They rest on other sources, whose accuracy is not guaranteed and the article may not interpret such results correctly. Do your homework before making any decisions and consider consulting a professional advisor.
Horizons' HFP is the least sensitive to interest rates, with a duration of only 0.9, a reflection its policy to keep holdings in short-term resets and floating rate preferreds. BMO's ZPR theoretically should fit in between HFP and the others, with its strategy of holding preferreds that will reset rates in five or less years. But the price action of the various ETFs seen in the chart below contrasting ZLB vs the other preferred ETFs and XBB suggests that it behaves much like CPD. And HPR has been less volatile than CPD and ZPR - it looks as though the active management strategy of HPR "to preserve capital" has been effective.
Despite the higher duration of XBB, CPD and ZPR dropped more in 2013 when interest rates took their upward spike.
Attractive payouts and reasonable but volatile returns
An important lesson for investors is that preferred share ETFs can be quite volatile compared to bonds. In 2008-2009 during the credit crisis and the recovery, CPD took a big drop in 2008 with a 17.2% negative return and in 2009 with a 26.2% positive return while XBB toddled along smoothly at +6.1% and +5.0% respectively.
Our second comparison table below shows recent cash payout rates. Four of the ETFs are paying out 4.1 to 4.9% depending on which payout measure is used, while HFP is paying 2.1 (trailing 12 months) or 3.4% (current yield). That's attractive income compared to XBB's 3.2% distribution yield and 2.4% yield to maturity, especially when tax rates are taken into account (it can take $1.30 of pre-tax interest to equal the net after-tax of $1 of dividends in a taxable account, though this varies depending on the investor's tax bracket and province) and the fact that a good chunk of the preferred ETF payouts has been non-taxed Return of Capital.
However, not all is sweetness and light. Returns - which includes both dividends and capital gains/losses - have not been nearly so attractive in the short term. Three of the four (CPD, ZPR and PPS) that have been around long enough (at least a full year) to officially report returns show negative 1-year returns. The 2013 interest rate rise hurt capital values. In addition, the capital losses seen in the above price chart have caused the ETFs to have bad Return of Capital, merely giving investors their own money back. As a recent Raymond James Canadian Preferred Shares Report points out (see pages 2-3) many of the Reset preferreds are being and will be called in 2014 by the issuers and new issues will have lower dividend rates. The reality of the low interest rate environment is being absorbed and cash payouts have been falling.
It is very hard to predict exactly how an investment in these preferred ETFs will fare. There is such a mix of inter-acting factors that can affect eventual returns and future income / cash payouts - interest rates, most obviously, but also credit risk, call risk (likelihood of issues being redeemed prematurely, when it advantages the issuing company and not the investor), the required return differential between government debt and corporate preferreds, the variable mix of types of holdings within each ETF and the wide variety of special redemption or retraction features attached to the types of preferred shares. Finally, and ironically, to some extent the tail is wagging the dog - flows into or out of the ETFs themselves are so large that they affect the market for underlying preferred shares according to Scotia McLeod's annual Guide to Preferred Shares 2014 edition. Unlike bond index funds whose future possibilities under rising interest rates we examined last year, we would hesitate to forecast the probable evolution of any of these ETFs in detail. Certainly, if interest rates rise, the capital value / market price of the ETFs will fall in response, but by how much and for how long is too hard to tell.
Bottom line - Though it is not possible to predict exactly what will happen, the ETFs would slot into a fixed income portion of a portfolio as follows:
- Horizons' HFP fits as a reasonably stable short-term holding that generates better after-tax income than a short-term bond fund
- The others are best considered for longer term or indefinite time holdings to generate fairly steady income superior in varying degrees over the years to bond funds but with volatility in capital value.
Disclaimer: This post is my opinion only and should not be construed as investment advice. Readers should be aware that the above comparisons are not an investment recommendation. They rest on other sources, whose accuracy is not guaranteed and the article may not interpret such results correctly. Do your homework before making any decisions and consider consulting a professional advisor.
No comments:
Post a Comment